Net cumulative return
The compounded change in portfolio value over the actual holdout after the frozen transaction-cost model. +5.26% means 100 units of starting capital end at about 105.26 under the evaluator's assumptions.
Prospective falsification case study
The final experiment returned +5.26% net over the frozen holdout and a +20.50% annualized arithmetic mean return. It was still classified FALSIFIED because the Sharpe and dependence-aware confidence criteria did not pass.
Reading the result
The headline metrics answer different questions. These short definitions are the interpretation used on this page, not additional evaluation criteria.
The compounded change in portfolio value over the actual holdout after the frozen transaction-cost model. +5.26% means 100 units of starting capital end at about 105.26 under the evaluator's assumptions.
Here this is an arithmetic annualization: mean daily net return multiplied by 365. It is a standardized rate, not the amount the portfolio actually gained during the year.
Return relative to volatility after costs. Higher values mean more return per unit of observed variability. The frozen rule required at least 0.50; Research 005 recorded 0.368.
The largest peak-to-trough decline in portfolio value during the holdout. −29.59% means the worst fall from a previous equity high was almost thirty percent.
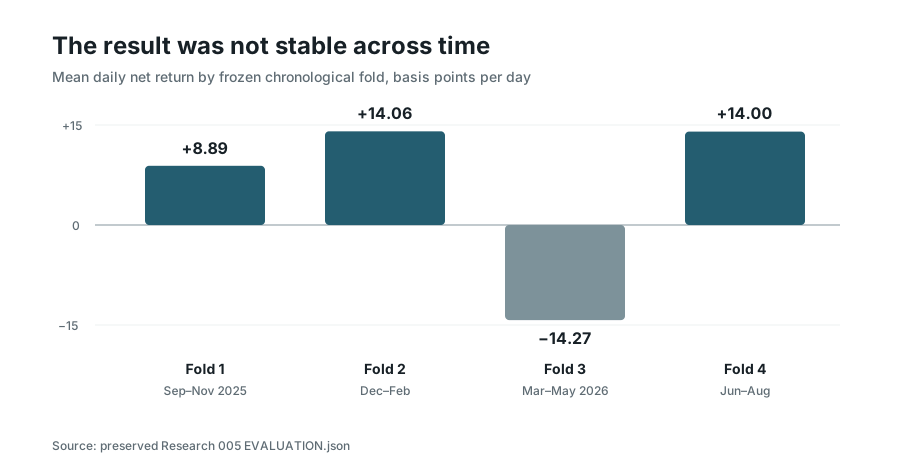
The holdout was split into four consecutive time blocks to check whether positive mean returns recurred through time. Three were positive and one was negative.
A conservative lower confidence bound on mean daily return that allows for changing volatility and serial dependence. Because the one-sided 95% lower bound was below zero, the required evidence for a positive mean return was not established.
Research 005 was a one-shot prospective extension of an independently reproduced channel-breakout strategy. The holdout produced a positive return, but the complete acceptance rule had been written down before the data was captured. Two required conditions failed, so the terminal result remained FALSIFIED.
That distinction is the point of the case study. A number can look attractive without being enough to pass the experiment that produced it.
The experiment inherited the executable semantics reproduced in Benchmark 004 rather than reopening strategy design. The universe contained 66 symbols and was fixed as of 31 August 2025. The protected period was the next 365 physical days, from 1 September 2025 through 31 August 2026.
The strategy was not a generic description of “breakout trading.” Its executable details were frozen:
sqrt(rolling volatility) scaling and daily normalization;Some of those choices are unconventional. That was deliberate. Research 005 was testing the already reproduced executable object, not improving it after the fact.
Benchmark 004 also found several places where the external notebook’s explanatory prose and executed code did not fully agree. The reproduction followed the executed code and documented those discrepancies before the later prospective test. That distinction matters: a reproducible strategy has to be defined by executable behavior, not by whichever description looks cleaner afterward.
The provider contract allowed exactly one official Binance daily-kline request for each of the 66 frozen symbols, with no automatic retries and no alternate-provider fallback. The later runner executed 66 requests and recorded the capture as complete.
“Complete” did not mean that every symbol had a bar on every physical day. Sixty-five responses contained 365 daily klines; OMUSDT contained 183. The frozen rules already specified how legitimate venue absences were represented as missing data, so the shorter series was not repaired, substituted or used to change the universe after inspection.
This is a small detail, but an important one. A prospective data contract should define what happens when the market does not hand you a perfectly rectangular panel.
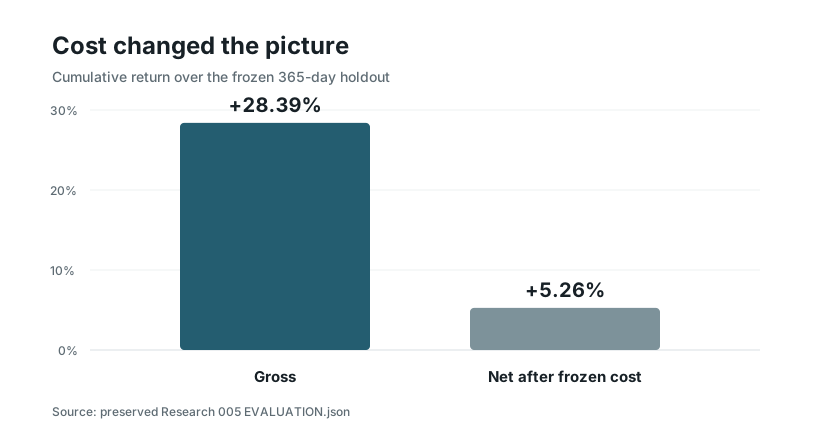
The reported annualized net return of +20.50% is the frozen evaluator’s arithmetic annualization: mean daily net return multiplied by 365. The actual compounded net cumulative return over the 365-day holdout was +5.26%.
Those figures answer different questions. Volatility and path dependence make an annualized arithmetic mean diverge from compounded wealth. Treating the larger number as “the strategy made 20.5%” would misstate the recorded result.
The cost effect was also large. Gross cumulative return was +28.39% before the frozen turnover charge and +5.26% after it. Average turnover was about 0.272 per day; under the fixed 20 bps rule that corresponds to roughly 5.4 basis points of average daily cost before compounding effects.
No post-result fee reduction was allowed.
The terminal decision was not based on a single headline metric. SURVIVED_RESEARCH required every frozen criterion to pass.
Five did. Two did not.
The net Sharpe ratio was about 0.368, below the required 0.50. More importantly, the one-sided 95% Bartlett-HAC lower bound on mean daily net return was negative. The HAC calculation used all 365 physical daily returns and a frozen 33-day lag, preserving temporal dependence rather than substituting an IID standard error after seeing the result.
The four chronological folds were mixed rather than uniformly positive. Fold 1 averaged about +8.89 bps/day, fold 2 +14.06 bps/day, fold 3 −14.27 bps/day, and fold 4 +14.00 bps/day. Three positive folds were enough to pass that criterion, but the negative third fold is still visible evidence of instability across time.
Maximum drawdown was about −29.59%, comfortably inside the frozen −50% survival boundary, but the drawdown lasted as long as 207 days. Passing a permissive drawdown gate did not rescue the failed Sharpe and confidence criteria.
Because that would turn the experiment back into strategy search.
After seeing +20.50% annualized net return it would be easy to argue that a 0.368 Sharpe was “close enough,” that the confidence bound was too conservative, that 20 bps cost was excessive, or that the weak fold should receive less weight. Any of those changes might be reasonable questions for a new experiment. They are not valid reasons to rewrite this one.
The frozen decision specification explicitly prohibited rescue semantics: no changed costs, parameters, dates, universe, provider, fold selection, direction reversal or alternative signal after the terminal result was known.
That is why the outcome is useful even though it is negative. The experiment retained the ability to say no.
Research 005 was not a live-trading qualification. The strategy can hold negative weights while the evidence source is Binance Spot OHLCV. Borrow availability, funding, margin, liquidation and derivatives basis were outside the experiment. The frozen 20 bps turnover charge is a research cost model, not proof of executable short-side economics across all 66 symbols.
The result also does not prove that channel breakouts can never work. It says something narrower and stronger: this frozen executable strategy, on this frozen universe and holdout, did not satisfy its predeclared survival rule.
No strategy was authorized for promotion into the separate trading runtime.
This page is derived from the preserved Research 005 terminal bundle rather than a fresh replay. The source bundle contains the terminal result, deterministic evaluation, capture receipt, frozen strategy and decision specifications, runner/build identities, raw provider responses and SHA-256 manifests.
For publication, the detailed raw market payloads are not reproduced here. The selected text artifacts below expose the frozen experiment, strategy, decision rule, evaluation, and terminal outcome directly. The two charts use only metrics already recorded in the terminal evaluation. Nothing on this page retunes or re-evaluates the strategy.
Frozen decision rule
Survival required every criterion to pass. A positive return did not override the failed Sharpe and HAC conditions.
Inspect the evidence
These five files are byte-for-byte text artifacts selected from the preserved Research 005 terminal bundle. They expose the frozen experiment and strategy, the decision rule, the deterministic evaluation, and the terminal verdict without publishing raw market payloads, binaries, private paths, or unrelated runner material.
c3d88fd9a9dee10b9fe4c08c9f826c7e2269f4ea54e396b1c5776e36204b0dfa
Deterministic evaluation
The 365-day metrics, chronological folds, criterion booleans, HAC result, and drawdown.
SHA-256
83dab48e7cf7684feaf43c8245d5f6381e4ea89d7f005f1b6b085534e09b33e6
Frozen strategy specification
The exact reproduced executable semantics carried into the protected holdout.
SHA-256
562908e8ba433d66f136299ef45594ab3b3b9d113b49f559ea91422656692121
Frozen decision specification
The deterministic metrics, seven survival criteria, and no-rescue rule fixed before evaluation.
SHA-256
c3c51fb05eba1872e4d8c02adacc65758a262e06d9a3dbf75b36734f3af3f3f2
Frozen experiment definition
The parent lineage, 66-symbol universe, protected dates, provider contract, and authority boundaries.
SHA-256
799ffd35820836fd6877bddfe962c5a07b87aa397ecd58cf4443d949d87e4e11