R
A fixed initial-risk unit based on the distance from actual entry to the frozen stop. Reporting in R avoids inventing an account size or leverage model. It is not a percentage return on trading capital.
Popular strategy · frozen evaluation
We converted Data Trader's 5-minute Bitcoin range-fade rules into a bounded deterministic specification before evaluation. On one year of complete post-publication BTCUSDT data, the implementation produced 739 trades and failed its predeclared survival rule.
Here, FALSIFIED means this experiment failed its predeclared acceptance rule—not that every version of the strategy is disproved or that the original source is wrong.
Reading the result
The headline metrics answer different questions. These short definitions are the interpretation used on this page, not additional evaluation criteria.
A fixed initial-risk unit based on the distance from actual entry to the frozen stop. Reporting in R avoids inventing an account size or leverage model. It is not a percentage return on trading capital.
The share of executed trades with positive gross trade outcome. The strategy targeted roughly +2R on winners and −1R at the stop, but day-end exits, costs, and execution rules mean win rate alone does not determine net performance.
Average trade outcome after the frozen per-side transaction-cost model. The primary 15-bps-per-side evaluation recorded −1.1948R per executed trade.
Net R aggregated by New York calendar day, including zero on no-trade days, then averaged across all 365 days. This was a primary acceptance metric.
A one-sided 95% lower confidence bound for mean daily net R using Bartlett-HAC with a frozen 20-day lag. Survival required the lower bound itself to be above zero.
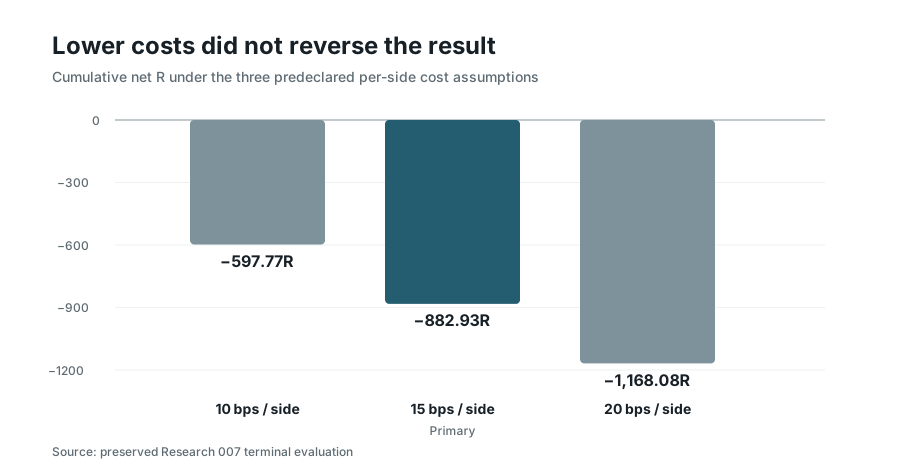
The primary cost was 15 bps per side. The 10- and 20-bps alternatives were frozen in advance as diagnostics only; they could not replace or rescue the primary result.
A deterministic version of Data Trader’s popular 5-minute Bitcoin range-fade strategy was fixed before evaluation and then run once on a complete one-year post-publication BTCUSDT sample. It produced 739 trades, a 28.01% win rate, negative aggregate net R in all four frozen chronological folds, and a terminal result of FALSIFIED.
The lower-cost diagnostic was strongly negative too. Transaction costs made the result worse, but they did not create the failure.
Here, prospectively frozen describes our research procedure: the source interpretation, dates, execution rules, costs, metrics, and acceptance criteria were committed before the Research 007 outcome was inspected. The market observations are historical today. This was not a forward-monitored or live-trading test.
The source video presents a failed-breakout setup built around the first four-hour candle of the New York trading day.
The practical outline is:
That combination is appealing partly because it is easy to see on a chart. It also looks unusually testable for a strategy presented in a video rather than a formal specification.
But “easy to explain” and “deterministic enough to evaluate” are not the same thing.
Most of the source examples describe the stop around the extreme of the breakout move. Other examples place it at the original range boundary. For unusually large breakouts, the video introduces alternatives such as a nearby resistance level or an order block.
Those choices matter. A stop defines both the loss and the distance used to calculate a 2R target. Moving it changes the trade mechanically.
There is no defensible way to reconstruct a “nearby resistance level” or “order block” from hindsight-free OHLC data without adding another rule that the source itself does not uniquely specify. Research 007 therefore did not pretend those discretionary overrides were objective.
The frozen primary interpretation used the breakout-move extreme from the first qualifying outside close through the confirming re-entry bar. The discretionary key-level substitutions were excluded. That does not establish that this was the creator’s only intended interpretation; it establishes exactly what our evaluator tested.
Several implementation details had to be settled before evaluation rather than chosen from the eventual trade list.
Research 007 used BTCUSDT as the explicit Bitcoin market-data proxy and official public Binance Spot 5-minute OHLC data. Trading dates were defined in America/New_York, while the four-hour reference candle followed the frozen exchange-native interpretation: the first native four-hour candle whose displayed opening time belonged to that New York date. We did not manufacture a new four-hour bar beginning at New York midnight.
A breakout required a 5-minute close strictly outside the range. Re-entry required a later close strictly back inside it on the same New York date. Entry occurred at the following 5-minute open, not at the confirmation close.
The remaining execution rules were equally explicit:
Those are research conventions, not claims that the video uniquely dictates every one of them.
The evaluation window was fixed mechanically as the first complete calendar month after the video’s publication through the last complete calendar month before Research 007 began: 1 September 2025 through 31 August 2026, by New York trading date.
The exact UTC capture envelope was 2025-09-01 04:00:00Z inclusive through 2026-09-01 04:00:00Z exclusive.
The capture produced 105,120 normalized 5-minute rows through 106 bounded official-public Binance requests. The evidence contained the exact expected continuity: no missing rows, no duplicate repair, no filling, and no evaluator invocation before the capture was complete.
The normalized dataset identity was:
d53c103ba184c7fa0b7736ac5280d2341f82884ad17ce89453e9680e129b7182
The capture receipt identity was:
91b9a9cd9903fddaa261e29941d41f077918353a0a4b275521aed4067aa1cc34
This matters more for a 5-minute strategy than it might seem. A missing or silently reconstructed bar can alter an outside close, a re-entry, an extreme, or the order in which an exit appears to occur.
The evaluator executed 739 trades: 367 long and 372 short. It recorded 207 wins and 532 losses, for a 28.01% win rate.
There were 169 target exits, 397 stop exits, and 173 day-end liquidations. Three trades encountered a bar where both stop and target were reachable from OHLC and were resolved adverse-first under the frozen rule. One otherwise-confirmed setup failed the frozen next-open execution gate and was not executed.
With a nominal +2R target and −1R stop, a simplified cost-free calculation suggests a break-even win rate near one-third. The observed 28% rate is below that reference point, but that comparison is only a useful intuition check. The actual evaluation also contained transaction costs, day-end exits, next-open entries, and conservative bar-level execution rules, so the terminal result cannot be reduced to “28% versus 33.3%.”
Under the primary 15-bps-per-side model, mean net outcome was −1.1948R per trade. Mean daily net R across the 365 New York dates was −2.4190R, and cumulative net R was −882.93R.
The one-sided 95% Bartlett-HAC(20-day) lower bound on mean daily net R was −2.9234R/day. The annualized daily-net-R Sharpe recorded by the frozen evaluator was −11.02.
The terminal reason recorded by the evaluator was:
PRIMARY_MEAN_DAILY_NET_R_NOT_STRICTLY_POSITIVE
The primary cost assumption was fixed at 15 basis points per side: 10 bps for the taker-fee assumption plus 5 bps of additional synthetic execution drag for spread/slippage.
Research 007 also froze two diagnostics in advance, at 10 bps and 20 bps per side. They were not alternative tests that could replace the primary outcome.
| Cost per side | Mean net R / trade | Mean daily net R | Cumulative net R | HAC lower 95% | Positive folds |
|---|---|---|---|---|---|
| 10 bps | −0.8089R | −1.6377R | −597.77R | −1.9903R/day | 0 / 4 |
| 15 bps | −1.1948R | −2.4190R | −882.93R | −2.9234R/day | 0 / 4 |
| 20 bps | −1.5806R | −3.2002R | −1,168.08R | −3.8602R/day | 0 / 4 |
The lower 10-bps assumption improves every economic number, as expected. It does not move the result close to zero: mean performance remains strongly negative, the confidence bound remains below zero, cumulative net R remains negative, and all four folds remain negative.
So the defensible statement is not “fees killed the strategy.” It is narrower: costs materially worsened an already negative deterministic result.
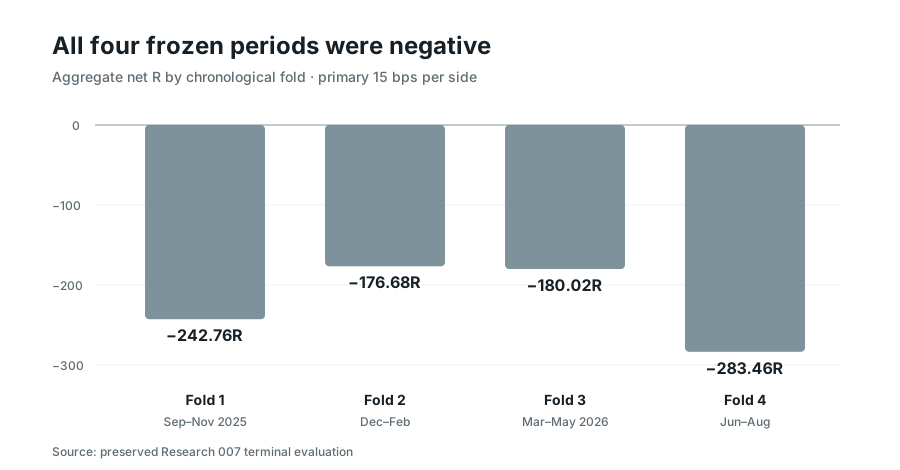
The one-year sample was divided into four chronological blocks before evaluation. This was meant to make it harder for one favorable interval to dominate the headline result.
| Frozen fold | Aggregate net R at 15 bps/side |
|---|---|
| 1 Sep – 30 Nov 2025 | −242.76R |
| 1 Dec 2025 – 28 Feb 2026 | −176.68R |
| 1 Mar – 31 May 2026 | −180.02R |
| 1 Jun – 31 Aug 2026 | −283.46R |
The survival rule required at least three of four folds to have positive aggregate net R. Research 007 recorded zero.
This makes the interpretation less dependent on a single confidence calculation. The negative result was distributed across the full year rather than being created by one isolated quarter.
The source is not a complete executable specification. Research 007 tested a bounded deterministic implementation of its reproducible core.
That distinction sets the limit of the conclusion. The evidence supports saying:
The deterministic implementation of the Data Trader range-fade mechanism produced no economically viable edge in the frozen post-publication BTCUSDT sample. Performance was negative across all four chronological folds and remained strongly negative under the lower predeclared 10-bps-per-side cost diagnostic.
It does not establish that every discretionary interpretation of the video’s setup has been disproved. A trader who chooses support, resistance, order blocks, or different stops case by case is making decisions outside this experiment’s deterministic contract.
Nor is this an accusation about the creator. The research question was not whether the examples in the video were honest. It was what happens when the reproducible part of the mechanism is written down before evaluation and then applied without post-result adjustment.
In the video’s Bitcoin walkthrough, the creator totals seven backtested trades: five wins, two losses and +8R, described as about a 72% win rate. The video immediately adds the important caveat that seven trades are not enough for an accurate performance estimate and recommends testing a much larger sample.
Research 007 did exactly the second part, but under a frozen deterministic contract. The evaluation generated 739 executed trades over a complete year. The purpose of that larger sample was not to make the source look bad; it was to give the rule many more chances to encounter ordinary conditions: repeated breakouts, narrow and wide stops, day-end exits, losing streaks, and different market regimes.
The contrast is useful rather than adversarial. A handful of chart examples can teach the setup clearly. A large controlled sample answers a different question: what distribution of outcomes appears when the same reproducible rules are applied repeatedly without choosing the examples afterward?
Research 007 was not a live-trading qualification. The short leg is a symmetric research payoff calculated on the Binance Spot reference series; the experiment did not model borrow availability, leverage, margin, liquidation, perpetual funding, or an executable short venue.
Five-minute OHLC also cannot reconstruct the historical bid/ask path inside each bar. The evaluator therefore used explicit conservative rules for same-bar ambiguity and a frozen synthetic execution-cost model rather than claiming tick-level execution realism.
The result is not a universal statement about failed-breakout trading, New York sessions, or 5-minute scalping. It is a terminal result for this deterministic interpretation, this post-publication sample, this execution model, and these predeclared criteria.
No qualification decision followed. Nothing was exported to the separate trading runtime, and no paper or live order was placed.
This page is a publication of the closed Research 007 record. The strategy was not rerun, retuned, or re-evaluated for this article.
The completed lineage was:
source discovery → capability assessment → ambiguity register → deterministic mechanism → signal/execution specification → prospective experiment freeze → official-public data capture → immutable normalization → deterministic evaluation → FALSIFIED terminal result → immutable novelty registration
The principal terminal identities are:
d53c103ba184c7fa0b7736ac5280d2341f82884ad17ce89453e9680e129b718291b9a9cd9903fddaa261e29941d41f077918353a0a4b275521aed4067aa1cc343ad29b94b5c5feda1662142f85ffc5f4f3fc00be22bbabb5655978145f11265dbaf6a005705d215efda751719a54bed4a942cbca860450c79b41da1bd70682f58a0527ccbdb54219608ebe2f83e65ba2f00927c7f2c6c241b36556856d9288c0The terminal counters record 106 provider calls, one evaluator invocation, and zero qualification decisions, exports, product communications, paper orders, or live orders. The evaluation stage itself made no provider calls; it consumed the already completed immutable capture.
The selected result summary below is preserved from the publishing handoff. The full trade-level terminal object, raw-provider object store, and normalized 105,120-row market dataset remain outside the public site.
Frozen decision rule
The dataset was complete and the trade-count threshold was exceeded. The primary mean, dependence-aware lower bound, and chronological-fold requirements all failed.
Inspect the evidence
This preserved Research 007 result summary is copied byte-for-byte from the terminal publishing handoff and exposes the verdict, principal metrics, fold totals, counters, and key lineage identities. The full trade-level terminal object, raw Binance responses, and the 105,120-row normalized dataset are not republished here.
These excerpts support inspection of the reported work; they are not a complete package for independently rerunning the experiment. Read the evidence policy.